
みなさんこんにちは!ヒロポンです!
今回は有料のIDEにしてはトップクラスのシェアを誇るIntellijのDNAを受け継いだWeb系専用のIDE「WebStorm」でReactをデバッグする方法を書いていきます!
今回は下記の記事で取り上げたプロジェクトをデバッグの対象として進めていきます!
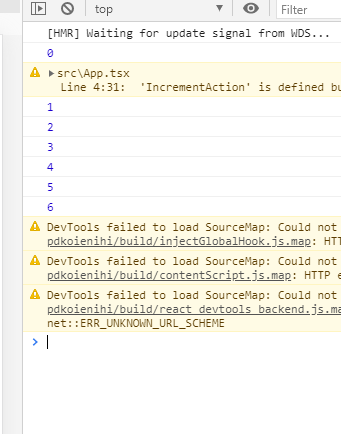
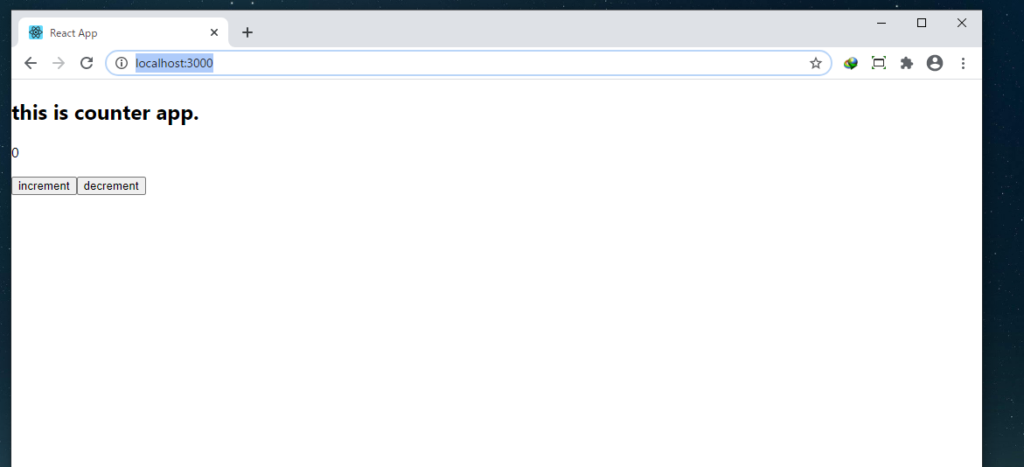
求める結果はWebブラウザのConsoleがWebStormのデバッグConsoleに出てきてほしい
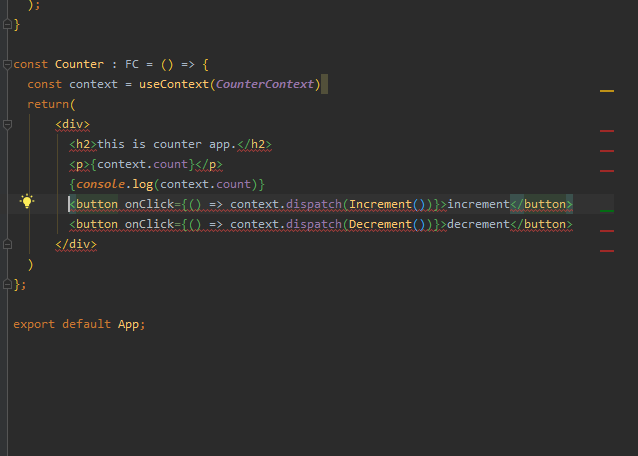
IncrementとDecrementを押したらConsoleにcountが表示されます。
まずはJetBrains IDE Supportをダウンロード
https://chrome.google.com/webstore/detail/jetbrains-ide-support/hmhgeddbohgjknpmjagkdomcpobmllji
ここからJetBrains IDE Supportをダウンロードします。
これが無いと何も始まりません。
拡張機能が正常に入ったら下記のような感じになります。
WebStorm側でデバッグ設定を入れる
で次はWebStorm側でデバッグの設定をしていきます。
構成の追加を押す
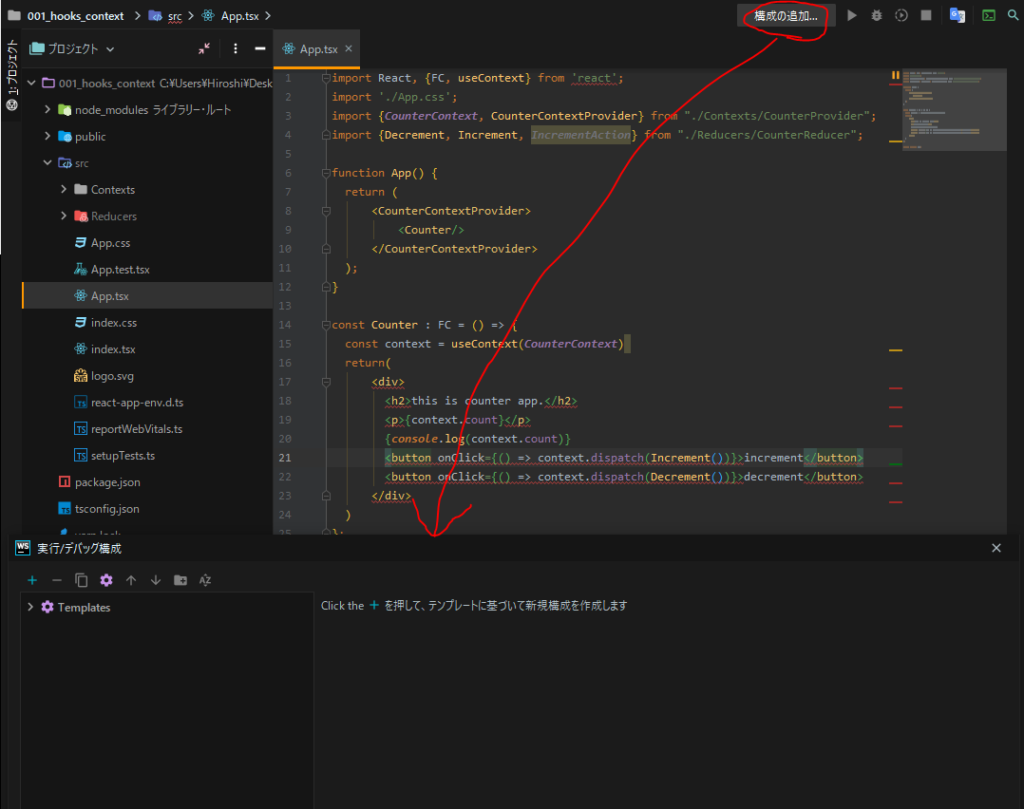
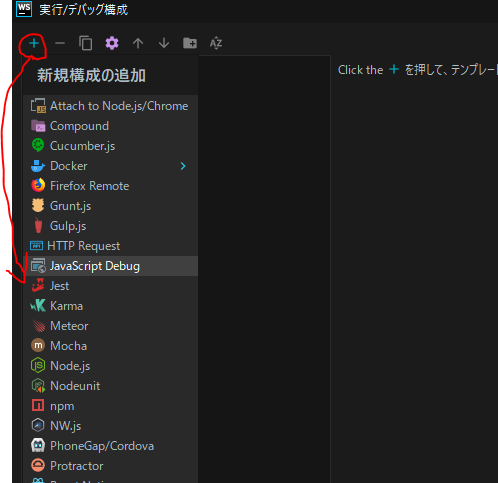
+ボタンを押してJavaScript Debugを選択
Debugに好きな名前を付けて監視するUrlを入れる
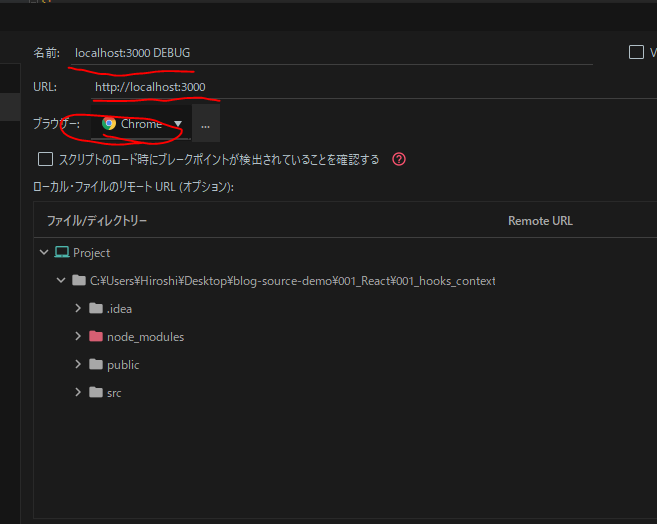
今回はReactなのでlocalhost:3000を監視したいので上記のような設定にしました。
またChromeの拡張機能としてJetbrains IDE Supportを入れているので、ブラウザをChromeに設定します。
デバッグできてるかの確認
yarn startでサーバーを立ち上げる
とりあえずこんな感じでサーバーを立ち上げます。
デバッグボタンを押す
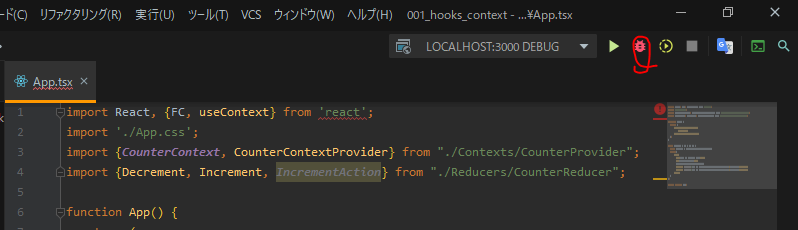
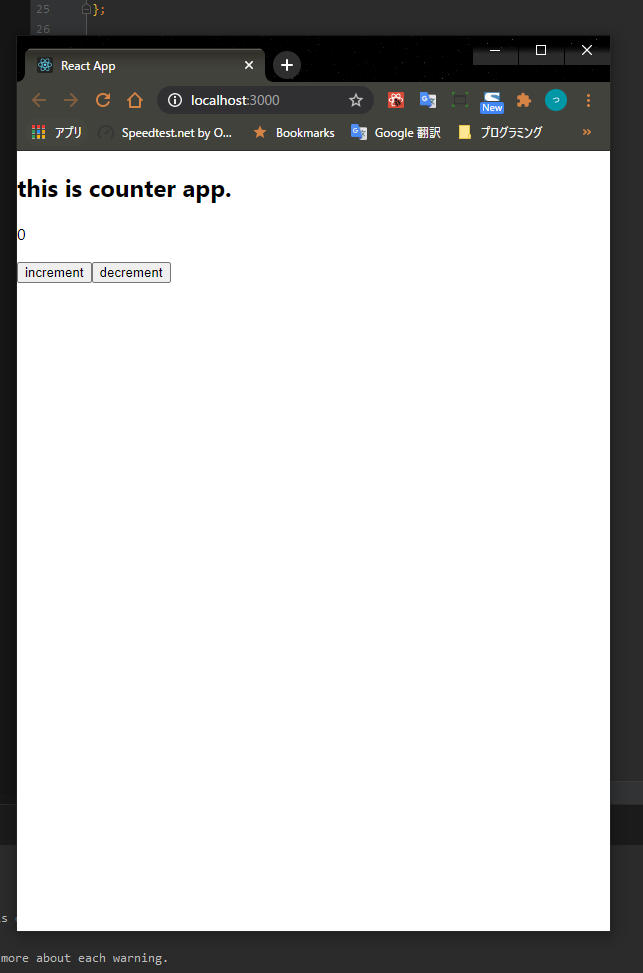
このボタンを押すと先ほどChromeを指定したので、Chromeが立ち上がります。
Debugで立ち上げたブラウザは別ウインドウで立ち上がって、全体的に白くなっているので、Debugから立ち上がったことがわかると思います。
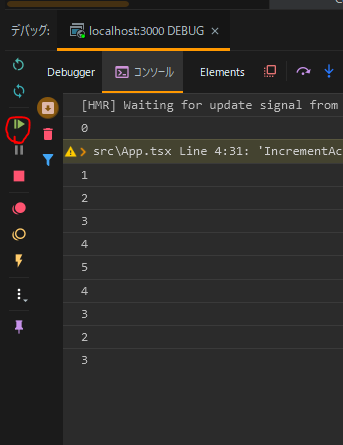
この状態でWebstormのDebugコンソールを見てみると下記のようになっています。
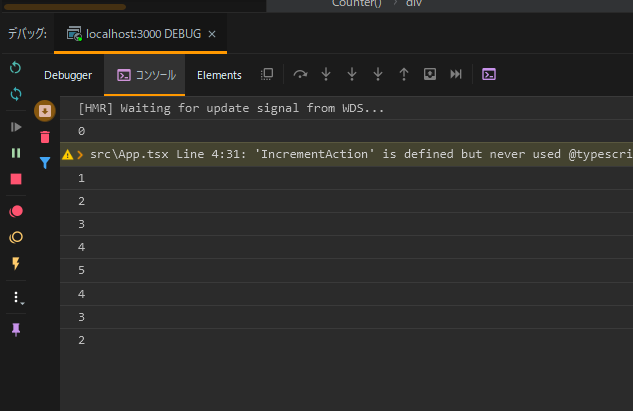
ちゃんとデバッグされてますね!
念のためブレークポイントを仕掛けてみます。
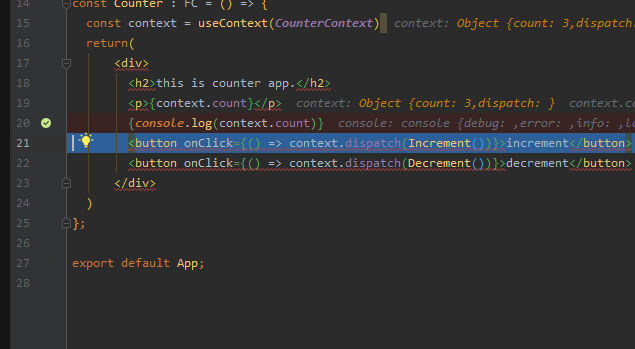
ちゃんとブレークポイントで止まっていますね!
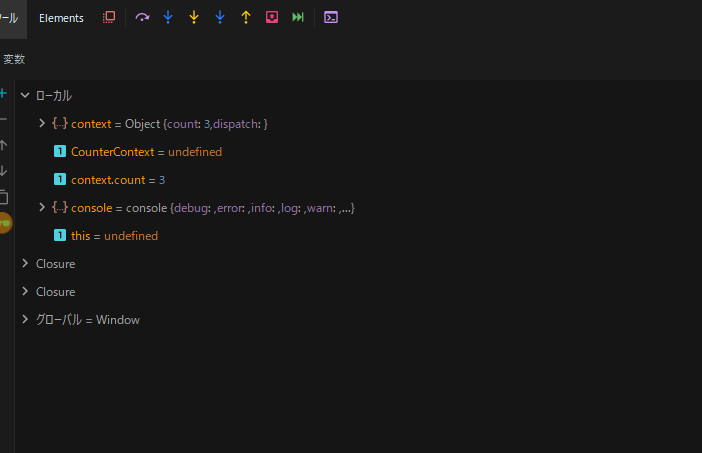
止まっている状態での中身もこれでわかります!
プログラムを再開するには下記を押してください!

コメント